Monitor collection performance
Track impressions, clicks and CTR across your collections over any window, and spot which ones are trending up.
Analytics shows how shoppers engage with your ranked collections. The Overview tab summarises impressions, clicks and click-through rate, then breaks it down per collection with a trend line — so you can see what’s working. Five more tabs sit beside it, covering revenue impact, movers, per-config history, the For You funnel and the raw visitor list.
Analytics is a Pro feature. (Every new install runs on the Growth feature set for its first 10 days — see Your first 10 days.)
1. Open Analytics
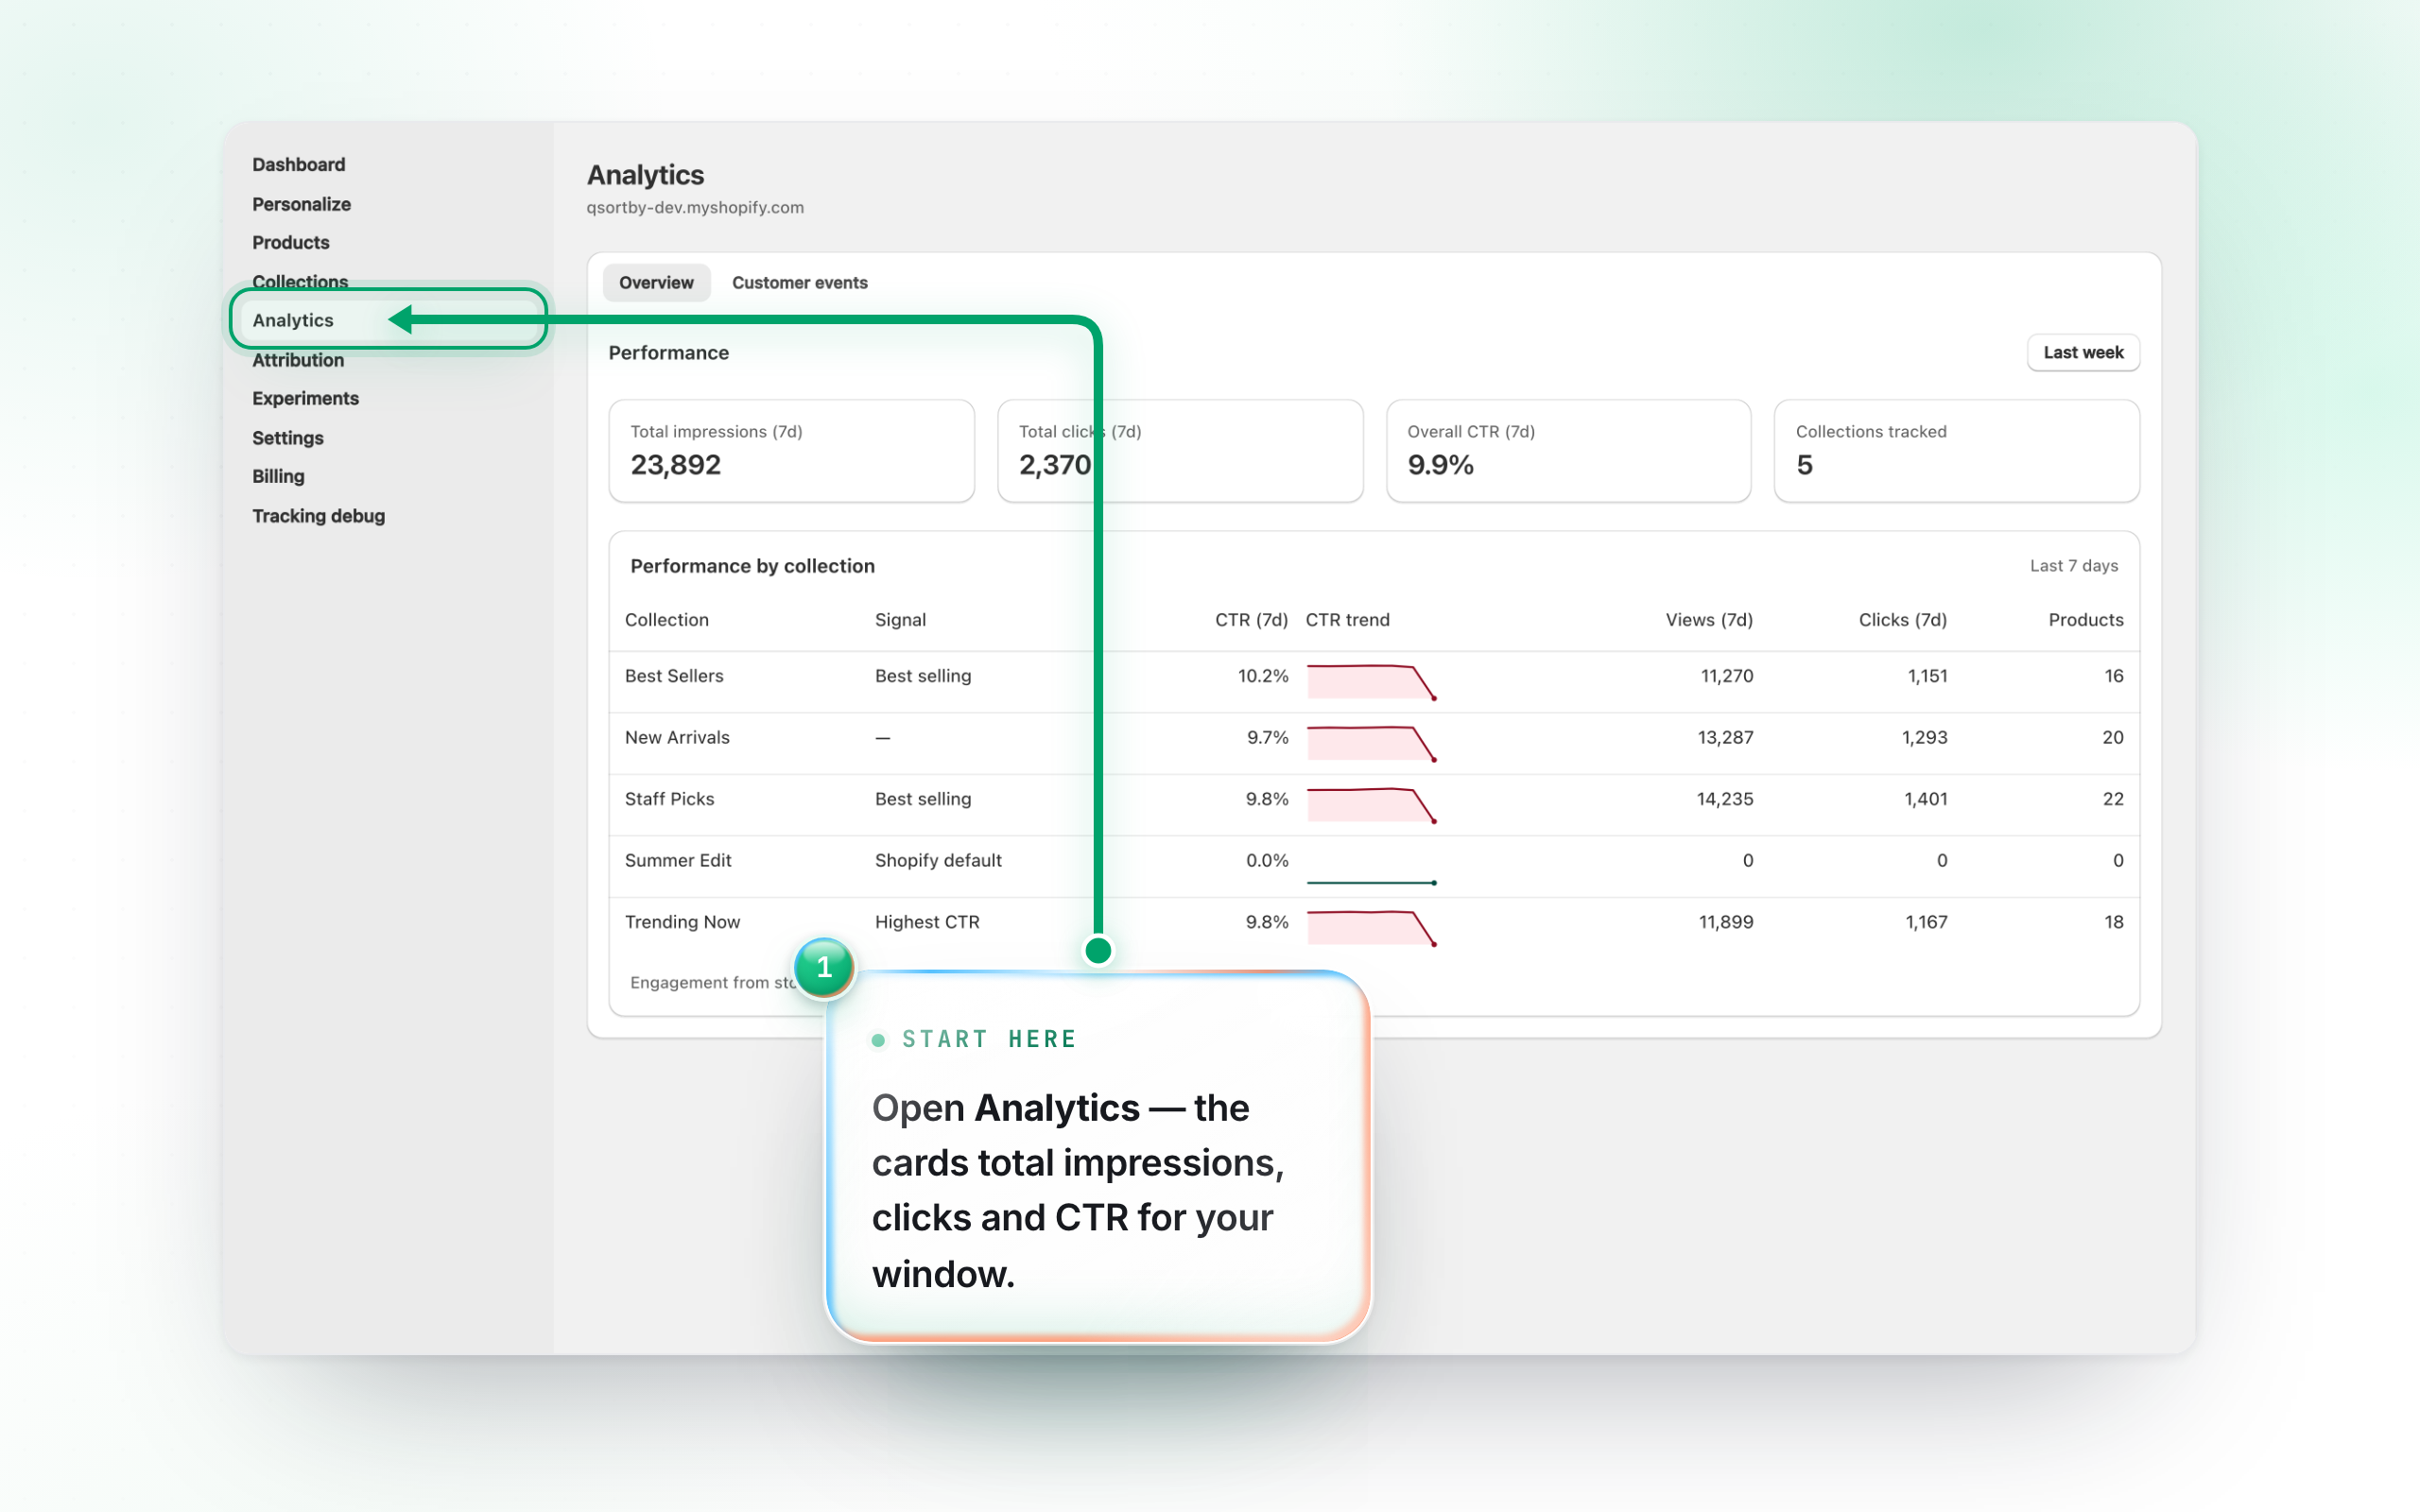
Open Analytics from the left menu. The cards up top total your impressions, clicks, overall CTR and how many collections are tracked over the window you choose (top-right).
2. Read performance by collection
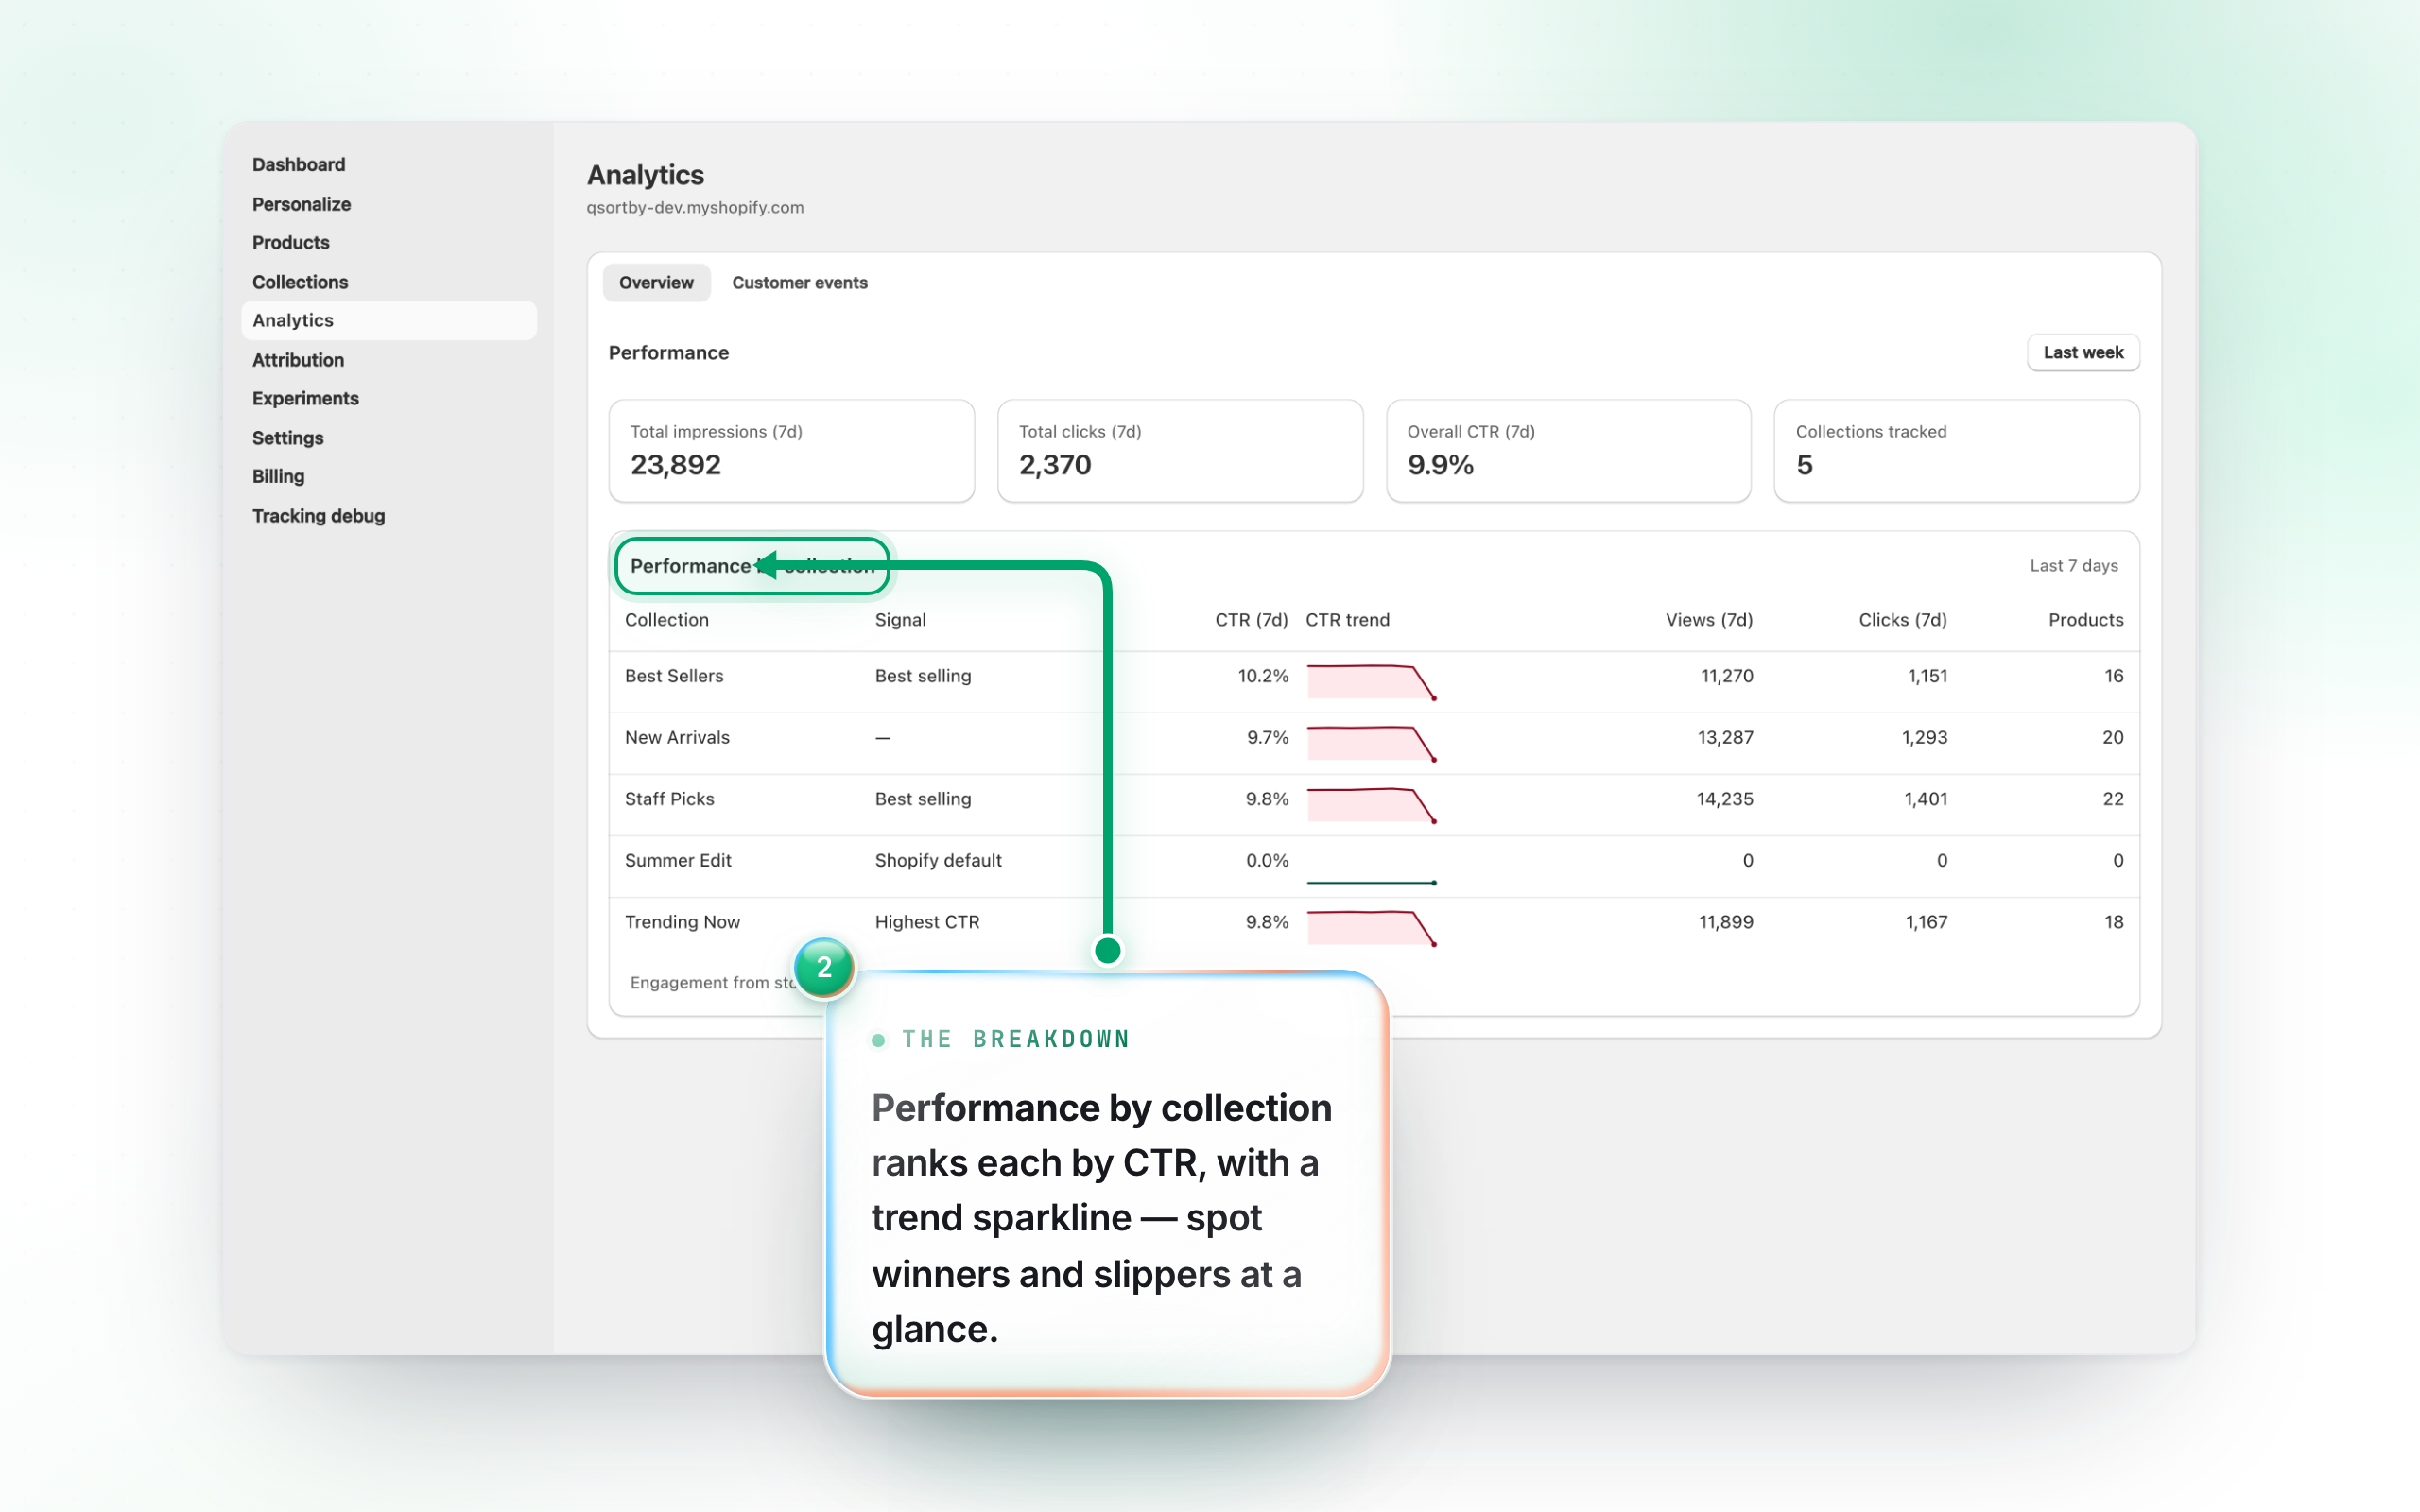
The Performance by collection table ranks each collection by CTR, with the signal it’s sorted by, a little CTR trend sparkline (green = rising, red = falling), and its views, clicks and product count. It’s the fastest way to see which sorted collections are earning their clicks.
3. The other four tabs
Overview is the entry point; four more tabs sit beside it and load when you open them.
- Impact — influenced orders and revenue against your store totals, with influenced AOV next to overall AOV and a daily series.
- Trending — products rising and falling on revenue, with the change and growth rate behind each move.
- Sort projects — what each ranking config earned while it was live: attributed orders, revenue, AOV and feed CTR per config version, so a sort you’ve since changed is still judged on its own window.
- Personalization — the For You feed’s own funnel: impressions, clicks, cart adds, orders and revenue, split by device and by A/B variant.
4. Switch to Customer events
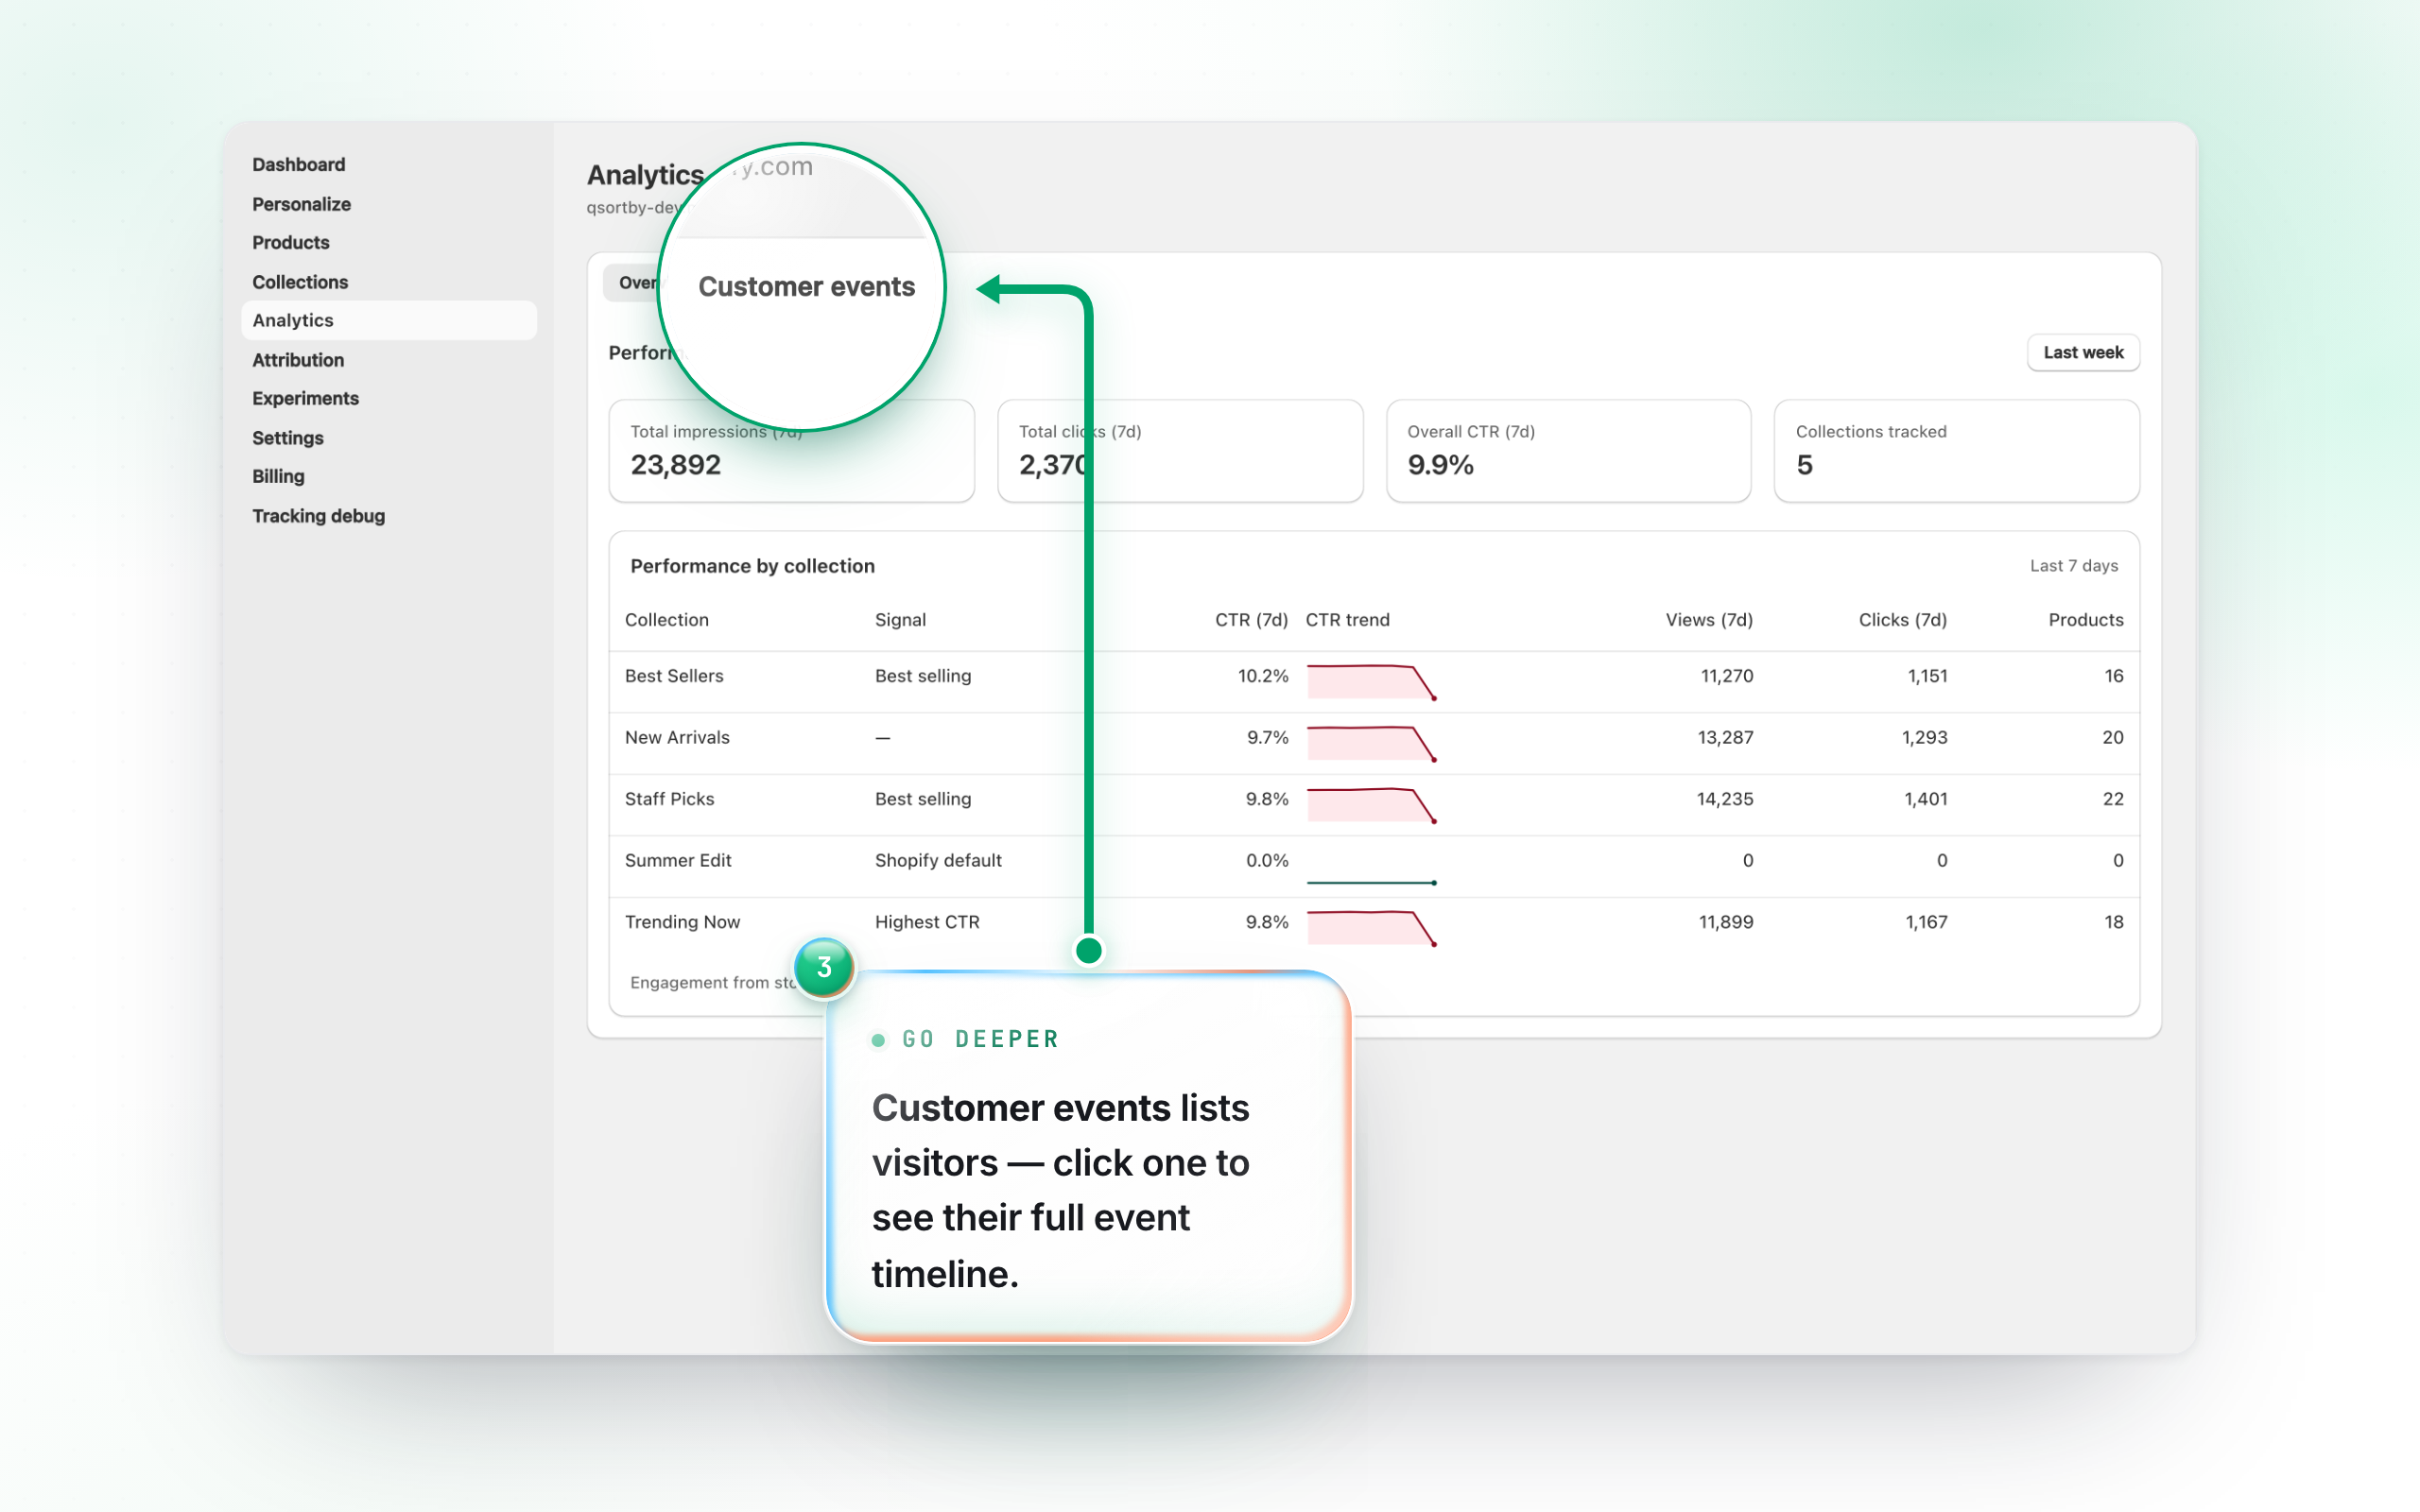
The Customer events tab lists individual visitors — filter by device, browser or type, and click any row to see that shopper’s full event timeline. Great for understanding behaviour behind the numbers.